Mite count tracking software: what works and what doesn't

TL;DR
- Mite count tracking software runs from free spreadsheet templates to dedicated apiary apps like BeeKeepR, ApiaryBook, and Hive Tracks.
- None of them replace an accurate alcohol wash or sugar roll.
- The right tool does help you spot colony-level trends, catch a threshold crossing before the population crashes, and keep treatment records clean enough to actually review each season.
Why does tracking varroa mite counts matter more than a single reading?
A single mite wash tells you the infestation load on one day, in one colony. Useful. But varroa populations double roughly every 16 to 22 days under good mite reproduction conditions, so one count without context is a snapshot with no movie behind it. Count 1.5% in late June, count again in mid-July and see 3.2%, and you know the colony is racing toward the 2% action threshold the Honey Bee Health Coalition recommends for most of the U.S. [1]. Without that first number on record, the second count is just a number.
Tracking over time also fixes a bias most of us carry without noticing. We remember the high counts because they scared us, and forget the boring ones. A written or digital log has no memory bias. It shows you that colony three in your West yard has crossed 2% by August three seasons running, no matter which treatment you ran the previous fall. That pattern is information. Acting on it is how you stop losing that colony every other October.
For sideliners running 20 to 150 hives, paper record-keeping turns genuinely hazardous around year two. Logs get wet. Colonies get renumbered. Last year's data lives in a notebook nobody can find. Software, even a well-built spreadsheet, gives you something searchable. That's the real payoff.
What mite count thresholds should your software alert you to?
Set your alert at 2%. The Honey Bee Health Coalition's Varroa Management Guide, the most widely cited threshold source in North American beekeeping, puts the action threshold at 2% for colonies with brood during the honey-production season, and 2% again heading into winter [1]. Some extension programs use 3% as a summer threshold and still push treatment above 2% in late summer, because that late-summer population becomes the long-lived winter bees [2]. The University of Minnesota Bee Lab recommends monthly monitoring with intervention at or above 2 mites per 100 bees [2].
Whatever form your tracking takes, it should let you set a threshold value and flag any colony that meets or exceeds it. A good app lets you set different thresholds by season, because what passes in May does not pass in August. The HBHC guide states it flatly: "A 2% infestation level means 2 mites per 100 bees" [1]. No gray area. It's a line.
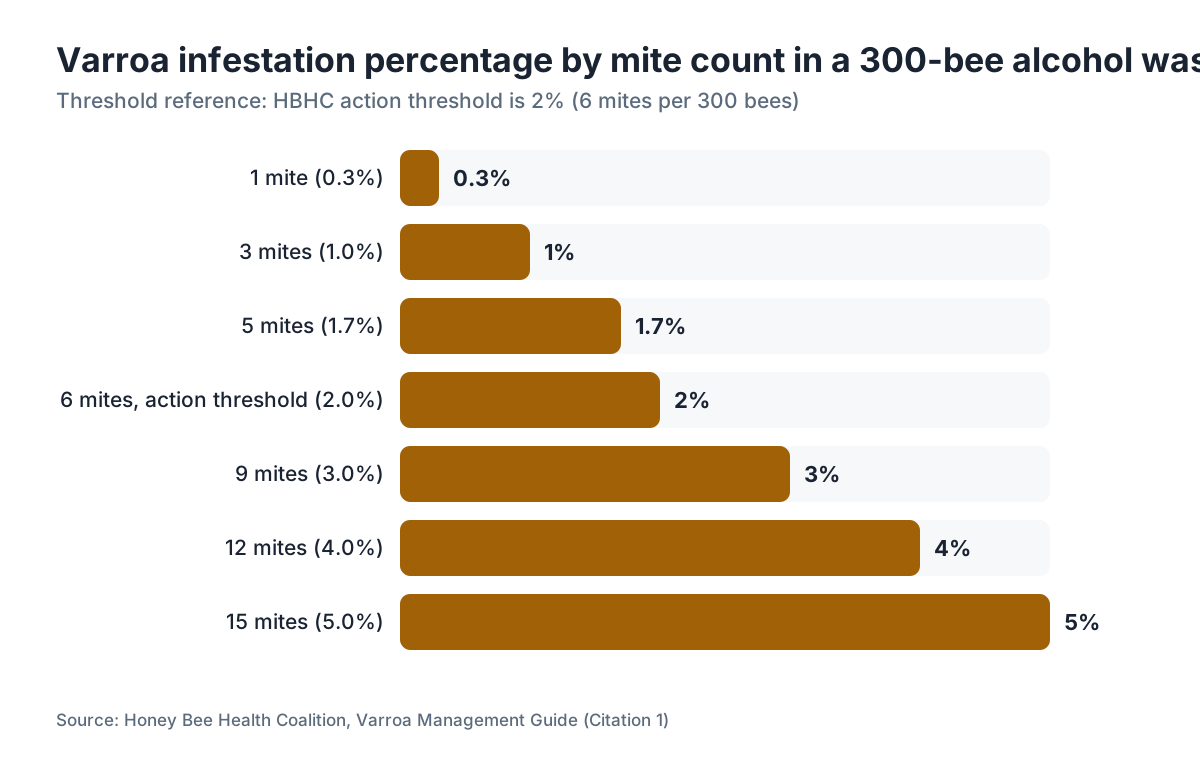
Here's what those percentages come out to in a typical 300-bee alcohol wash sample:
| Mite count (300 bees) | Infestation % | Status per HBHC guidance |
|---|---|---|
| 1-2 mites | 0.3-0.7% | Monitor, no immediate action |
| 3-5 mites | 1.0-1.7% | Watch closely, recount in 2-4 weeks |
| 6 mites | 2.0% | At action threshold |
| 9 mites | 3.0% | Above threshold, treat promptly |
| 12+ mites | 4.0%+ | High infestation, treat immediately |
Any software worth using makes entering raw mite counts and sample sizes effortless, and calculates the percentage for you. Do the division by hand every time and you will eventually blow it on a tired morning.
See also: varroa mite for the biology behind why these thresholds exist.
What free or low-cost mite count tracking tools actually exist?
The honest landscape is sparse. No single free app does everything well. What you have is a spectrum.
At the simplest end, the Honey Bee Health Coalition offers a downloadable mite monitoring log as part of its Varroa Management Guide resources, a paper or PDF form you print and fill out [1]. It isn't software. But it's free, credible, and structured right. Plenty of beekeepers photograph the filled form and drop the image in a phone folder labeled by year. Not elegant. It works.
For a spreadsheet approach, University of Florida IFAS extension publishes colony inspection forms and monitoring templates you can open in Google Sheets or Excel [3]. Add conditional formatting so cells turn red above your chosen threshold. Twenty minutes of setup, then it runs itself.
On the dedicated app side, the main options as of 2025:
- Hive Tracks (hivetracks.com): web-based apiary management platform, free tier available, colony inspection logs with mite count fields. Runs in a browser, no install needed.
- ApiaryBook: mobile-first app with inspection records, mite count fields, and calendar reminders for recount dates. Free basic version.
- BeeKeepR: iOS and Android, tracks inspections, treatments, and queen status. Mite count entry built in.
- BeePlus: European-origin app, good for small operations, has mite threshold alert settings.
None of these apps has been independently validated in a peer-reviewed study for accuracy or usability that I can point you to. The closest thing is a 2019 survey of precision beekeeping technologies, and it covered sensor systems, not record-keeping apps [4]. So you're going on community experience and your own trial.
VarroaVault offers its own free mite tracking and protocol tools at varroavault.com if you want something built around varroa management without the general apiary-management overhead.
Manage multiple yards and want data you can export and analyze yourself? Keep a parallel Google Sheet even if you use an app. Apps get abandoned by their developers. Your CSV doesn't.
How do you log an alcohol wash count correctly in any tracking system?
The alcohol wash is the standard for varroa monitoring. The UC Davis apiculture program calls it "the most accurate field method for estimating mite load on adult bees" [5]. An accurate count fed into lousy logging is still useful. An inaccurate count fed into beautiful software is not.
The standard method: collect about 300 adult bees (roughly half a cup) from the brood nest area of the frame, not bees returning from foraging. Drop them in a jar with isopropyl alcohol at 70% or higher. Shake 30 to 60 seconds, pour through a mesh screen, count the mites that fall through [1][5].
When you log it, record all of these fields:
- Colony ID (consistent, across every tool you use)
- Date of count
- Number of bees in sample (actual count if you weighed or estimated)
- Number of mites found
- Calculated infestation percentage
- Brood status at time of count (capped brood present or not, because a brood-free period changes how you read the number)
- Any treatment applied and date
- Who performed the count (matters in multi-person operations)
Software that skips field six, brood status, is missing something real. A 2% count during a brood break is less alarming than a 2% count with heavy capped brood, because in the second case a big reservoir of mites is sitting inside sealed cells, invisible to the wash. Some apps let you add notes. Use that field for brood status if there's no dedicated box.
Take a 300-bee sample, find 6 mites, and your infestation is 2.0%. The math is mites divided by bees, times 100. Write that as a formula in your spreadsheet, not something you do in your head.
Can software use photos or AI to count mites automatically?
This is the corner of the field generating the most research interest right now. The honest answer: it's getting real, but it isn't ready for field use yet.
Several academic groups have published computer vision models that detect varroa on bees in images with meaningful accuracy. A 2022 study in Computers and Electronics in Agriculture tested a convolutional neural network on sticky board and bee images and reported mite detection accuracy above 90% under controlled conditions [6]. Controlled conditions means good lighting, a consistent background, high-resolution images. Your phone camera on a sunny afternoon with bees moving is not controlled conditions.
The COLOSS BeeBook, a collaborative reference framework for honeybee research methods, notes that automated image-based detection is a promising complement to manual counts but has not been standardized for field use [7]. Nobody has published a protocol that says "use app X at resolution Y and get results within Z% of a manual wash." That work hasn't happened at scale.
So, practically: if an app claims fully automated mite counting from phone photos, treat it as a prototype or a toy to explore, not a replacement for a wash. Sticky board counting apps, which help you count mites that fell naturally onto a board, are more reliably useful, because the mites are stationary on a flat surface. Those have been around since at least 2018 and work fine as long as you photograph the board cleanly.
Expect this field to improve. The academic interest is real. As of mid-2025, no AI counting app has been validated to alcohol-wash accuracy.
What's the difference between tracking mite counts and tracking mite drops?
They measure different things, and mixing them up gives you bad data.
A mite wash or sugar roll counts mites on adult bees. It gives you infestation rate: the share of the bee population carrying mites. This is the number that maps to treatment thresholds [1].
A natural mite drop count, also called a sticky board count, measures how many mites fall off bees over a set period, usually 24 or 72 hours. It correlates loosely with colony infestation, but it swings with colony size, season, temperature, and whether you run a screened bottom board. The HBHC guide notes that natural mite drop is "less reliable than an alcohol wash for determining whether treatment is needed" [1].
Some apps let you log both. Fine. Just don't substitute one for the other. Natural mite drop beats nothing as a trend signal between formal washes, but it shouldn't be the number driving a treatment decision. Your software should let you label which type of count you're entering.
For beekeepers running 40 or more colonies, a common setup is weekly sticky board checks logged in the software to catch sudden spikes, paired with monthly formal washes on a rotating sample of colonies. You get both granularity and accuracy without washing every hive every week.
How often should you enter data into your mite tracking software?
Every 30 days at minimum during the active season. The Honey Bee Health Coalition recommends monitoring at least monthly, and the UC Davis bee lab suggests monthly as a floor with more frequent checks from July through September, the highest-risk window in most of the U.S. [1][5].
Monthly monitoring gives you about 5 to 6 data points between spring buildup and winter prep. Enough to see a trend if you don't miss any. Miss two months in a row during late summer and you've lost the window that matters most.
The right cadence for data entry is simpler: whenever you count, log it the same day. Not the next morning. Not "later this week." Memory of an exact count degrades inside 24 hours, especially across multiple yards. Every app on the market lets you enter a count from your phone while you're still standing at the hive in your veil. Do that.
For treatment records, enter the treatment type, product name, EPA registration number, date applied, and date removed (for strips) the day you do each action. This isn't just tidy beekeeping. Sell honey or bee products commercially and treatment records with EPA registration numbers become part of good agricultural practice documentation, and some state departments of agriculture may ask to see them [8].
How do you compare mite data across multiple colonies or yards?
This is where software earns its keep over paper. Comparing 40 colonies in a notebook means flipping pages. Comparing 40 colonies in a spreadsheet or app means sorting a column.
The most useful views in any mite tracking tool:
- Current infestation percentage by colony, sortable highest to lowest
- Trend over time for a single colony (line chart, at least 3 data points to mean anything)
- Colonies above threshold flagged in a different color or grouped separately
- Treatment history by colony with post-treatment counts to judge efficacy
If your app has no trend view, build one in a spreadsheet: dates on the X axis, infestation percentage on Y, one line per colony. That chart tells you which colonies are structurally problematic versus which ones just had a rough month.
For multi-yard operations, grouping by location matters. If yard B runs consistently higher than yards A and C, you have a location or genetics question to answer more than a mite question. Software that filters by location is worth having. Most of the apps above support location tagging.
The University of Minnesota Bee Lab uses this kind of cross-colony comparison to track regional mite pressure through sentinel hives [2]. Approximate that in your own operation: designate two or three colonies per yard as sentinels, monitored every two weeks instead of every four, and compare them against the rest.
What should you look for when choosing mite count tracking software?
The features that actually matter, ranked by how often their absence causes real trouble:
- Data export. If you can't pull your data out as a CSV or spreadsheet, you're renting your records from whoever runs the app. Apps shut down. Companies pivot. Five years of mite data should be yours to keep and move.
- Flexible colony ID. You number your hives. The app should use your numbering, not force its own. Renaming hives mid-season inside an app is how data gets orphaned.
- Percentage auto-calculation. Enter raw mite count and sample size, get the percentage. Basic, and some tools still skip it.
- Treatment logging linked to colony. The efficacy question, does my OAV treatment actually drop this colony below threshold 30 days later, only gets answered if treatment records and mite counts sit in the same system or the same spreadsheet.
- Threshold alerts. Even a simple conditional format in a spreadsheet counts. You want something that flags colonies above threshold without you eyeballing every row.
- Mobile entry. Can't enter data in the field? Then you won't enter data in the field.
Things that look great in screenshots and rarely matter in practice: weather integration, bee weight sensors, automated temperature monitoring. Those are precision beekeeping add-ons for large commercial operations or research programs. For a hobbyist or sideliner, they pile on cost and complexity without improving the one thing that matters, which is whether you catch a 3% count before it becomes a deadout.
See the varroa mite article for background on why treatment timing matters this much.
How do you use tracking data to evaluate whether your treatments are working?
Treatment efficacy is the most underused insight in any mite dataset. Most beekeepers know a treatment "worked" in a vague sense, because the colony survived winter. Fewer know the actual mite percentage before and after, which is the number that tells you whether the product did its job.
For oxalic acid vaporization, the EPA label sets specific application intervals and conditions, and published efficacy data shows mite drops of 90% or more under proper broodless conditions [9]. If your post-treatment count 30 days after OAV shows only a 40% drop, something's wrong. Either the application was off, the colony wasn't broodless, or you have a resistance signal. Your tracking data is what surfaces it.
For Apivar (amitraz strips), the label specifies a 6 to 8 week treatment period, and efficacy studies show 90 to 99% mite reduction when applied correctly to colonies with brood [10]. Pull your pre-treatment count from your log. Pull a count 6 to 8 weeks after removal. Calculate the percent reduction. Below 80%, investigate.
The HBHC guide recommends a post-treatment mite wash 3 to 5 days after an oxalic acid treatment for broodless colonies, and again 30 days after strip-based treatments [1]. Build those follow-up dates into your software as calendar reminders or scheduled events. Without the reminder, the follow-up count is the one that gets skipped most.
VarroaVault's free protocol tools include treatment efficacy calculators built on this before-and-after framework if you want a ready-made structure.
Keep treatment records specific: product name, EPA registration number, application method, date on, date off, and temperature at application for OAV (cold reduces efficacy). That's the difference between a treatment log you can learn from and one you can't.
Are there privacy or data ownership concerns with beekeeping apps?
Worth thinking about, especially since some apps are backed by agricultural data companies or research institutions with interests in aggregated colony health data.
Most apps here (Hive Tracks, ApiaryBook, BeeKeepR) don't have predatory data policies as of 2025. But terms of service change. Before you log five years of data anywhere, read the terms on data ownership and aggregated data use. The question you're asking is simple: can the company use your anonymized colony data for research or commercial purposes, and if so, did you consent to that?
For most hobbyists, this probably isn't a real concern. For sideliners who sell bees or honey, your production data, hive counts, treatment records, and colony strength notes are business-sensitive.
The safe move: use an app for convenience, export your data quarterly to a local spreadsheet you control. That's your insurance against a shutdown, a terms change, or anything else.
Frequently asked questions
Is there a completely free app specifically for tracking varroa mite counts?
Yes, several apps offer free tiers with mite count logging. ApiaryBook, Hive Tracks, and BeeKeepR all have free versions with colony inspection and mite count fields. The Honey Bee Health Coalition also provides free downloadable paper monitoring logs at HoneyBeeHealthCoalition.org. None of the free apps have been independently validated in peer-reviewed studies, so community reviews and your own trial are your best guide.
What is the action threshold for varroa mites I should program into my tracking software?
The Honey Bee Health Coalition recommends a 2% infestation rate as the action threshold during both the honey production season and late summer going into winter. In a standard 300-bee alcohol wash sample, 2% equals 6 mites. Some beekeepers use 3% as a summer threshold. Program your alert at 2% to buy reaction time before the population accelerates further.
Can I use a spreadsheet instead of a dedicated app for mite count tracking?
Absolutely, and for many beekeepers it's the better choice. A Google Sheet or Excel file with conditional formatting that flags cells above 2% gives you threshold alerts, trend charts, and full data ownership with no subscription. Extension programs including UC Davis and University of Florida publish free colony inspection templates you can adapt. The main limit is mobile entry, which needs either a phone-accessible Google Sheet or a willingness to log notes and transfer them later.
How do I know if my mite tracking app is calculating the infestation percentage correctly?
Check it by hand: divide mites by bees sampled, then multiply by 100. Find 7 mites in 300 bees and the answer is 2.33%. Enter that same scenario in your app and confirm it matches. If the app won't show what sample size it used in the calculation, that's a red flag, because sample size matters. A 7-mite count from 200 bees is 3.5%, not 2.33%.
Can AI or photo recognition apps replace an alcohol wash for mite counting?
Not reliably yet. A 2022 study in Computers and Electronics in Agriculture reported over 90% accuracy for AI mite detection under controlled lab conditions, but no app has been validated for field accuracy in published research. Sticky board photo counting apps are more usable, since the mites are stationary on a flat surface. For treatment decisions, an alcohol wash remains the recommended method per UC Davis and the Honey Bee Health Coalition.
How many colonies can I realistically track manually versus needing software?
Most beekeepers find paper logs work up to about 10 to 15 colonies. Above that, the volume of records and the need to compare colonies side by side makes a spreadsheet or app noticeably better. Sideliners with 30 or more colonies almost always benefit from digital tracking, mainly because they need to sort by mite load and find every colony above threshold fast, which a paper log can't do without manual scanning.
Should I track both alcohol wash counts and sticky board drops in the same software?
Yes, but label them clearly as different data types. Alcohol wash counts give you infestation percentage and drive treatment decisions. Natural mite drop counts give you a rough trend signal between formal washes. The Honey Bee Health Coalition notes sticky board counts are less reliable for determining treatment thresholds. Most apps have a notes field where you can specify the count method if there's no dedicated field.
How long should I keep mite count records before archiving or deleting them?
Keep at least three full seasons if you can. Less than that and you can't tell a one-year anomaly from a pattern. If you sell honey or bees commercially, treatment records may matter for regulatory compliance in your state, and some state agriculture departments recommend keeping records for a minimum of two years. Check your state's department of agriculture guidance for specific requirements.
What's the best way to track mite counts across multiple bee yards in different locations?
Use software that supports location or yard tags so you can filter by yard and compare infestation geographically. If your app doesn't support location grouping, add a yard column to a spreadsheet and use pivot tables to aggregate by location. Designating sentinel colonies, two or three per yard monitored twice as often as the rest, gives you location-level trend data without washing every hive every two weeks.
How do I use tracking data to tell if my oxalic acid treatment actually worked?
Record your infestation percentage before treatment, then run another alcohol wash 30 days after treatment is complete. For oxalic acid in broodless colonies, published efficacy data shows 90% or greater mite reduction when applied correctly. If your post-treatment count shows less than 80% reduction, investigate: brood presence at treatment time, temperature, and number of applications are the most common variables that cut efficacy.
Do mite tracking apps work without cell service in remote apiaries?
Most mobile apps store data locally and sync when connectivity returns, so you can enter data offline. Confirm this for any specific app before relying on it in a remote yard. Google Sheets also works offline if you enable offline mode in the app before you lose service. Check offline functionality during setup, not when you're standing in a yard with no signal.
What data should I always record alongside a mite count to make the record useful later?
At minimum: colony ID, date, sample size in bees, mite count, calculated percentage, and whether capped brood was present. Brood status matters because a 2% count with heavy capped brood is more serious than 2% during a broodless period, since capped mites don't show up in the wash. Treatment applied and date rounds out a complete record. Any app or spreadsheet missing one of those fields gives you an incomplete picture.
Sources
- Honey Bee Health Coalition, Varroa Management Guide: Action threshold of 2% mite infestation rate during honey production season and going into winter; alcohol wash as standard monitoring method; natural mite drop less reliable than alcohol wash for threshold decisions
- University of Minnesota Bee Lab, Varroa Monitoring: Monthly monitoring recommended with intervention at or above 2% mites per 100 bees; sentinel colony monitoring approach for regional mite pressure tracking
- University of Florida IFAS Extension, Honey Bee Colony Inspection: Colony inspection and mite monitoring templates available for download and use in spreadsheet software
- Zacepins et al., Precision Beekeeping Survey, Computers and Electronics in Agriculture, 2019: 2019 survey of precision beekeeping technologies covering sensor systems; record-keeping apps not independently validated in peer-reviewed literature as of survey date
- UC Davis Department of Entomology and Nematology, Honey Bee Research: Alcohol wash described as the most accurate field method for estimating mite load on adult bees; monthly monitoring recommended with more frequent checks July through September
- Bjerge et al., Real-Time Monitoring of Varroa, Computers and Electronics in Agriculture, 2022: Convolutional neural network for varroa detection in images reported accuracy above 90% under controlled conditions; not validated for open-field use
- COLOSS BeeBook, Standard Methods for Research on Apis mellifera: Automated image-based varroa detection is a promising complement to manual counts but has not been standardized for field use
- USDA National Agricultural Library, Bee Health: Treatment records with EPA registration numbers recommended as part of good agricultural practice documentation for commercial honey and bee product operations
- EPA, Oxalic Acid Product Registration and Label: EPA label requirements for oxalic acid vaporization application intervals and conditions; published efficacy shows 90%+ mite reduction under proper broodless conditions
- EPA, Apivar (Amitraz) Label and Efficacy Data: Apivar label specifies 6 to 8 week treatment period; efficacy studies show 90 to 99% mite reduction when applied correctly to colonies with brood
- Pennsylvania Department of Agriculture, Apiary Program: State agriculture departments may require beekeeping and treatment records; some recommend minimum two-year record retention for commercial operations
Last updated 2026-07-09