Spreadsheet for varroa monitoring: a hobbyist beekeeper's guide
TL;DR
- A varroa monitoring spreadsheet logs your alcohol wash or sugar roll counts, calculates mite-per-hundred-bees percentages, flags the 3% action threshold, and records treatments with dates.
- You don't need anything fancy.
- A free Google Sheet with four columns works.
- The payoff is trend data that shows whether a colony is building toward a crash before it's too late to stop it.
Why does tracking varroa in a spreadsheet actually matter?
Most hobbyist colony losses trace back to the same failure. The beekeeper didn't see the mite load rising until it was past the point where any treatment could save the cluster. A mental note from your last inspection doesn't cut it. Mite populations can roughly double every 12 to 15 days under favorable brood conditions [7], and if you're not writing numbers down and watching them move, you're guessing.
A spreadsheet gives you a trend, more than a snapshot. One alcohol wash tells you where you are today. Three washes over six weeks tell you whether you're winning or losing. That's the whole difference between a beekeeper who reacts and one who stays ahead.
Then there's the multi-hive problem. Keep four or more colonies and memory fails fast. Which hive hit 2.8% in June? Did you treat the nuc or just the production hive? A spreadsheet turns your apiary from a set of vague impressions into an actual data set. When one colony starts climbing while its neighbors hold steady, that's a signal worth catching early.
The Honey Bee Health Coalition's Varroa Management Guide recommends monitoring at least once a month during the brood-rearing season and again after every treatment [1]. That's eight to ten data points per colony per year. Without a log, those points vanish.
What should a varroa monitoring spreadsheet actually include?
You don't need a complicated workbook. The core columns are date, hive ID, monitoring method (alcohol wash or sugar roll), number of bees sampled, number of mites counted, and the calculated mite percentage. Everything past that is optional but useful.
Here's what a minimal working layout looks like:
| Column | What goes here | Example |
|---|---|---|
| Date | Inspection date | 2024-07-15 |
| Hive ID | Your colony label | Hive 3 / Yellow |
| Method | Alcohol wash or sugar roll | Alcohol wash |
| Bees sampled | Count or standard sample size | 300 |
| Mites counted | Raw number from your wash | 9 |
| Mite % | (Mites ÷ Bees) × 100 | 3.0% |
| Action taken | Treatment applied or none | Oxalic acid dribble |
| Notes | Queen status, brood pattern | Spotty brood noted |
The mite percentage column should be a formula, never something you work out by hand: =(E2/D2)*100 in Google Sheets or Excel. Lock it in so you're not doing arithmetic standing over an open hive.
Beyond the basics, add a column for colony strength (your own 1 to 5 scale or a frame-of-bees estimate), a separate tab for your treatment log with product name and dose, and a summary tab that pulls the most recent count per hive. The summary tab is the thing you actually look at before every inspection.
Conditional formatting earns its keep here. Set any mite percentage cell above 3.0 to fill red. The alert hits your eye before you've finished reading the row. Google Sheets does this in about 20 seconds under Format > Conditional formatting.
What is the right action threshold and where does it come from?
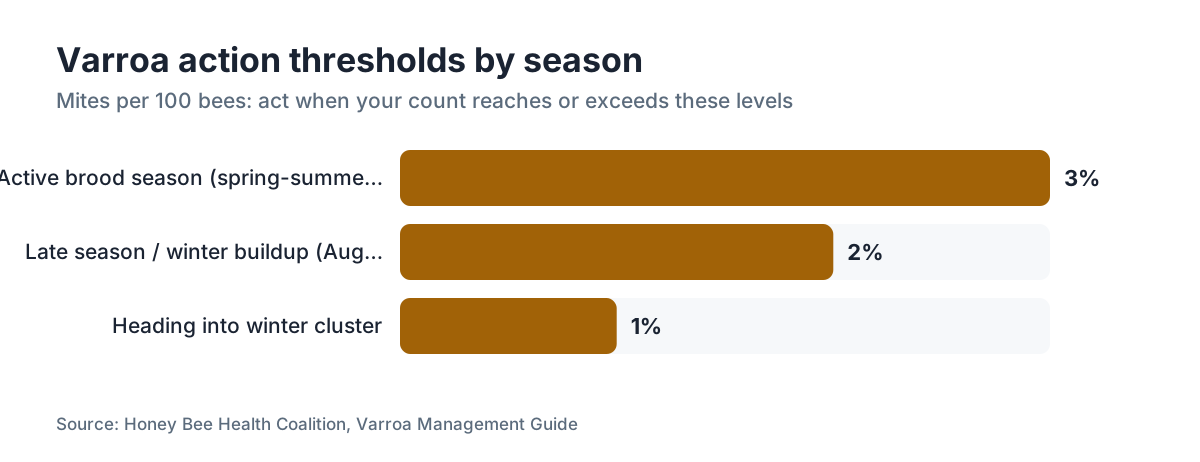
The widely used treatment threshold for varroa is 3 mites per 100 bees (3%) during the active season, and 2% or lower as you head into winter buildup [1]. Those numbers come from the Honey Bee Health Coalition's Varroa Management Guide, which pulls together research from several university extension programs and is the closest thing to a North American consensus document on this.
The 3% threshold isn't a cliff. It's a signal to act now, not proof your colony is already doomed. Many experienced beekeepers treat at 2% from August onward, because that's when colonies raise the long-lived winter bees, and mite-vectored deformed wing virus damage to those bees can't be undone after the fact [2].
Your spreadsheet should show the threshold plainly. One clean method: put a single cell somewhere on the sheet labeled "Action threshold" holding the value 3.0 (or whatever you've settled on), and point your conditional formatting rule at that cell instead of hard-coding 3 everywhere. Decide to tighten to 2% in August and you change one cell. The whole sheet updates.
State extension programs sometimes publish slightly different thresholds based on regional data. The University of Minnesota Extension notes the 2% late-season threshold and recommends treating before populations build for winter [2]. Your state's apiculture extension is always worth a look, because timing shifts with climate zone.
The alcohol wash is the most accurate common field method. The Honey Bee Health Coalition reports that sugar rolls undercount mites by roughly 40% compared to an alcohol wash [1]. If your spreadsheet mixes both methods across inspections, keep the "Method" column and read the numbers accordingly.
How do you actually sample bees and record the count?
The standard alcohol wash uses about 300 bees from a brood frame, which is roughly half a cup by volume [8]. Shake or roll the bees into a jar with 70% isopropyl alcohol (rubbing alcohol), agitate for 30 to 60 seconds, and pour through a mesh lid into a white tray. Count the mites in the tray. Count the bees too if you want an exact number, or lean on the half-cup convention as a proxy for 300.
For your spreadsheet, enter 300 in the Bees Sampled column when you use the half-cup method. If you actually count the bees (tedious but precise), enter the real number. The formula treats both the same.
Sugar rolls are the non-lethal alternative. Same bee volume, powdered sugar instead of alcohol, roll the jar for 60 seconds, then tap the mites out onto a white surface. They undershoot alcohol wash results, as noted above, but some beekeepers prefer them for nucleus colonies or when they'd rather not kill bees. Flag it in the Method column and consider a rough correction factor of 1.4 when you compare sugar roll numbers to alcohol wash numbers.
Record your sample right there in the field, on your phone or on paper to transfer later. A mite count reconstructed from memory 48 hours after an inspection is worth nothing.
How do you build this spreadsheet from scratch in Google Sheets?
Open Google Sheets and create a new blank spreadsheet. Name the first tab "Mite Log." In row 1, enter these headers starting in column A: Date, Hive, Method, Bees Sampled, Mites Counted, Mite %, Action Taken, Notes.
In F2 (the Mite % cell for your first data row), enter: =IF(D2="","",ROUND((E2/D2)*100,2))
That formula returns blank if no bees are entered, so empty rows don't throw divide-by-zero errors, and it rounds to two decimal places. Copy F2 down as many rows as you think you'll need. Say 500.
Now set up conditional formatting. Select the Mite % column (F2:F500), go to Format > Conditional formatting, choose "Greater than or equal to" and enter 3, then set the fill color to red. Add a second rule for values between 2 and 3 with a yellow fill if you want a warning zone.
Create a second tab called "Summary." Use MAXIFS or a pivot table to pull the most recent count per hive. A formula like =MAXIFS('Mite Log'!A:A,'Mite Log'!B:B,"Hive 1") gives you the latest date for Hive 1, and you can pair it with INDEX/MATCH to pull the matching mite percentage. This takes about 20 minutes to set up once and saves you scanning hundreds of rows on every visit.
Create a third tab called "Treatment Log" with columns: Date, Hive, Product, Method (dribble/vaporization/strip), Temperature at treatment, Brood Status (open/capped/broodless), Follow-up date. Cross-referencing treatments against later mite counts is how you find out whether a product actually worked in your conditions.
If building it from scratch sounds like a chore, the varroa mite resources page and several university extension programs offer free downloadable templates (see citations). The Honey Bee Health Coalition's website also links to field tools.
Which monitoring method gives you the most reliable data for your spreadsheet?
Alcohol wash is the benchmark. Multiple studies confirm it counts mites more accurately than a sugar roll, and it's the method the Honey Bee Health Coalition recommends for treatment decisions [1]. Sacrificing about 300 bees is genuinely trivial against a healthy colony of 40,000 to 60,000, and it's the only way to get numbers you can trust.
Sticky boards (bottom board inserts) give you a rough sense of mite fall but aren't a reliable basis for treatment decisions. Fall rates swing with colony size, brood area, ambient temperature, and whether foragers are tracking mites in from other hives. The Honey Bee Health Coalition states plainly that sticky board counts should not be your primary monitoring method [1]. Log them in a Notes column for context if you like, but don't let a low sticky board reading talk you out of a real wash.
DNA-based detection methods exist but they're research tools, not practical options for hobbyists in 2024. Brood uncapping counts show up in older literature but they're slow and less accurate than an alcohol wash.
For your spreadsheet to mean anything, stay consistent. Pick one method, stick with it, and flag any deviation clearly. Switch from sugar roll to alcohol wash midseason and the percentages before and after aren't directly comparable until you adjust for the undercount bias.
How often should you update your spreadsheet, and when in the season?
At minimum, the Honey Bee Health Coalition recommends sampling once a month during brood-rearing season and within a few weeks after each treatment to confirm it worked [1]. That's roughly six to eight entries per colony per year in a temperate climate. Keep four hives and you're looking at 24 to 32 rows a year, which is nothing to manage.
In practice, most experienced beekeepers sample more often during two high-risk windows. Late spring, when mite populations start compounding alongside brood expansion. And July through August, when colony populations begin dropping and the mite-to-bee ratio can spike fast. Monthly isn't aggressive enough through those stretches if you want to catch trouble early. Biweekly is better.
Post-treatment monitoring is not optional if you want the spreadsheet to earn its place. Treat in early August, then check again in late August. If your mite percentage hasn't dropped hard (say, from 4% down under 1%), the treatment failed. That could mean product resistance, an application error, or a brood-break problem. Without the post-treatment data point, you have no idea which.
Winter monitoring applies in climates where bees cluster for extended periods. During broodless phases every mite is riding an adult bee, so a winter alcohol wash reads very clean. Some beekeepers do one wash in December or January to confirm the fall oxalic acid treatment held. Log it in the same spreadsheet with a note that the colony was broodless.
Can you use your spreadsheet to track treatment effectiveness?
Yes, and this is honestly one of the most useful things a spreadsheet does for a hobbyist. The logic is simple. Record the mite percentage before treatment, record it again two to four weeks after, and calculate the reduction. A functional oxalic acid vaporization in a broodless colony should knock mite loads down by 90% or more [3]. See a 50% reduction and something went wrong.
For amitraz strips (Apivar), the window is longer. Efficacy builds over the first few weeks of exposure, and you typically judge it at six to eight weeks. A well-run Apivar treatment should bring counts from several percent down under 1% [4]. Log the strip-in date and strip-out date in your Treatment Log tab, then use the mite percentage data to draw the before-and-after comparison.
Hops-based products like HopGuard and formic acid products like Mite-Away Quick Strips (MAQS) and Formic Pro each carry their own efficacy profiles and temperature limits. The EPA product label is the legal reference for application conditions, and noting the temperature at treatment in your spreadsheet pays off, because some products lose efficacy or turn harmful outside their labeled range [5].
Over several seasons, your spreadsheet starts to tell you whether resistance is building in your local mite population. If amitraz treatments that used to cut loads by 90% are now cutting them by 60%, that's a trend worth taking seriously. Nobody has solid population-level resistance data for hobbyist apiaries, but your own multi-year records matter more to your operation than any regional average.
VarroaVault's free varroa management tools include a treatment log template built around exactly this before-and-after framework, which you can adapt to your own column structure.
What are common spreadsheet mistakes that give you bad data?
Sampling from the wrong frame is probably the most common error. Mites prefer capped brood, so the nurse bees on a brood frame carry higher mite loads than foragers at the entrance or bees on a honey frame. Always sample from a frame with visible capped brood [1]. Pull your sample from the wrong location every time and log those numbers, and your spreadsheet will systematically understate your mite loads.
Inconsistent sample sizes, unrecorded, are the second big mistake. Use 300 bees one visit and 200 the next without noting it, and your mite percentage formula is wrong half the time. Either standardize on 300 (half cup) every visit, or always enter the actual bee count.
Undated entries are an obvious one that still happens. A row that reads "Hive 2, 3.2%" with no date is useless for trend analysis. If you run a paper field log to transfer later, write the date on every page at minimum.
Over-relying on old data is the subtle one. A clean count from six weeks ago doesn't protect you today. Mite populations move fast, and beekeepers sometimes treat good numbers from a previous entry as if they were current. Your spreadsheet should show how many days since the last inspection right up front, so you can't fool yourself into calling a stale count fresh.
Ignoring the treatment log and logging only mite counts leaves you a data set that's hard to read. See a spike in August 2024 and you want to know whether you'd treated before it, what you used, and whether it worked. If your treatment history lives in a notebook somewhere, you've lost the context.
Are there free varroa spreadsheet templates you can download?
Several university extension programs publish free monitoring templates. Penn State Extension has published beekeeping management resources that include field data forms [6]. The University of Minnesota's apiculture program offers varroa management resources online [2]. The Honey Bee Health Coalition's website provides downloadable tools alongside their Varroa Management Guide, which is free to download as a PDF [1].
For a ready-to-use Google Sheets template with built-in formulas and conditional formatting, VarroaVault's varroa tools page offers a free download you can copy straight to your own Google Drive with no sign-up. That version includes the Summary tab and Treatment Log tab described above.
When you size up any template, check three things. That it calculates mite percentage from raw counts rather than asking you to enter a percentage (which forces you to do the math and invites errors). That it has a treatment log section separate from the monitoring log. And that it timestamps every entry. Templates with a single flat table and no summary view get painful to use once you have more than two seasons of data.
If you prefer Excel, everything in the Google Sheets section works identically. The formula syntax is the same. Google Sheets' one real edge is that it runs on your phone in the field without syncing a file.
How do you use your spreadsheet data to make better treatment decisions?
The spreadsheet's job is to answer three questions before every treatment call. What is the current mite load? Which way is it trending? And what's the brood status that decides which treatments are even on the table?
Current mite load is your most recent mite percentage. Above 3%, act. Between 2% and 3% in July or August, the trend question matters even more.
Trend is what a spreadsheet delivers that a single count never can. Plot your last three or four readings for a hive. Counts that read 1.2%, 1.8%, 2.4% over six weeks put you above 3% before your next planned check. Treat now, not in three weeks.
Brood status sets your options. Oxalic acid dribble and some vaporization treatments work best in broodless conditions, because mites inside capped brood are shielded from contact with the acid [3]. Amitraz strips (Apivar) work with brood present but need a full six-to-eight-week exposure [4]. Formic acid products want specific temperature ranges (typically 50 to 85°F for MAQS) [5]. Your treatment log should capture whether brood was present at treatment, so you can read the post-treatment count correctly.
Keep records for two or more seasons and colony-level patterns emerge. Some colonies in the same apiary run lower mite loads year after year. That's worth noting when you make queen-rearing decisions, though sorting genetics from management from plain luck takes careful recordkeeping over several seasons. The varroa mite biology section covers the reproduction cycle that explains why some hygienic colonies suppress mites more effectively.
What does a real beekeeper's varroa data look like over a full year?
To give you a concrete sense of a tracking log in practice, here's a realistic (illustrative, not from a named beekeeper) data arc for a single colony in a temperate North American climate:
March (post-winter inspection): 0.8% mite load, colony building.
May: 1.4%, population expanding, mite population growing with the brood.
July: 3.1%, threshold crossed, Apivar strips installed.
September (strips in seven weeks): 0.6%, treatment worked.
October: 0.9%, winter prep looks good.
December (broodless oxalic vaporization): 0.3%, colony heading into winter with a very low mite burden.
That's a colony that made it through. The decision point was July, when the spreadsheet showed the threshold crossed. Without the May count for context, the July number looks isolated. With it, you see a doubling in eight weeks and understand that waiting until August would have been a mistake.
Contrast that with a colony where you skipped the May count and July was your first entry since March. You'd see 3.1% and treat, but you wouldn't know how fast it was moving. Your spreadsheet only tells a story when the intervals hold steady.
For the supplies you'll want on hand across your monitoring sessions, the beekeeping supplies guide covers the kit, including alcohol wash jars.
Frequently asked questions
What is the action threshold for varroa mites I should put in my spreadsheet?
During the active brood-rearing season, the widely accepted threshold is 3 mites per 100 bees (3%). From July through early September, many beekeepers use a tighter 2% threshold, because colonies are raising the long-lived winter bees and mite-vectored virus damage in that window is especially harmful. Set your spreadsheet's conditional formatting to flag red at 3% and yellow at 2%.
How many bees should I sample for an alcohol wash?
The standard is about 300 bees, roughly half a cup by volume. Most protocols use the half-cup as a proxy rather than counting individual bees. Sample from a frame with capped brood, where nurse bees (which carry the highest mite loads) concentrate. Sampling foragers from the entrance or bees from a honey frame will understate your true mite load.
Is a sugar roll count accurate enough to put in my spreadsheet?
Sugar roll counts are usable but consistently undercount mites by roughly 40% compared to an alcohol wash, according to the Honey Bee Health Coalition. If you use sugar rolls, record the method and note that counts may run low. For treatment decisions, the alcohol wash is the more reliable method. Never mix sugar roll and alcohol wash data in the same trend line without adjusting for the difference.
How do I calculate mite percentage in Google Sheets?
In the Mite % column, enter =IF(D2="","",ROUND((E2/D2)*100,2)) where D2 is your bee count and E2 is your mite count. That gives you mites per hundred bees rounded to two decimal places, and returns blank rather than an error on empty rows. Copy the formula down the column. Add conditional formatting to fill any cell at or above 3.0 in red.
How often should I sample and update my varroa spreadsheet?
At minimum, once a month during brood-rearing season and within two to four weeks after every treatment. In practice, biweekly sampling from June through September catches population spikes faster. The Honey Bee Health Coalition recommends post-treatment monitoring to verify efficacy. More frequent entries mean better trend data. Skipping months leaves gaps that make the spreadsheet much weaker for catching early warning signs.
What columns does a varroa treatment log need?
At minimum: treatment date, hive ID, product name, application method (dribble, vaporization, strip), ambient temperature at treatment, whether brood was present, and the planned strip-out or follow-up date. Cross-referencing treatment entries against your mite counts before and after treatment is how you verify whether a product worked and whether you applied it correctly.
Can a spreadsheet help me detect varroa mite resistance to treatments?
Yes, over time. If amitraz strips that once dropped mite loads by 90% now manage 50 to 60% reduction, and you've ruled out application errors and temperature issues, that pattern across multiple seasons can point to developing resistance. Your spreadsheet won't give you lab-grade resistance data, but your own multi-year before-and-after records speak directly to your local mite population in a way no regional average can.
Where can I get a free varroa monitoring spreadsheet template?
The Honey Bee Health Coalition's website offers downloadable varroa management tools alongside their free Varroa Management Guide PDF. University extension programs including Penn State and University of Minnesota publish field monitoring resources. VarroaVault's varroa tools page offers a Google Sheets template with built-in formulas, conditional formatting, and a treatment log tab you can copy straight to your own Google Drive.
Should I use Google Sheets or Excel for my varroa log?
Both work identically for the formulas and conditional formatting described here. Google Sheets has two practical advantages for beekeepers: it runs on your phone in the field with no file syncing, and it's free with a Google account. Excel is the better pick if you want reliable offline work or already have it through a Microsoft 365 subscription. The spreadsheet structure is the same either way.
What is a realistic varroa monitoring schedule for a 4-hive hobbyist?
Plan on sampling all four colonies once a month from March through October, with biweekly checks from July through mid-September. That's roughly 24 to 32 monitoring events per year, each taking about 10 minutes per hive including setup and cleanup. Add post-treatment checks two to four weeks after every treatment. Budget about 15 hours total for monitoring across a full season for a four-hive operation.
Does a spreadsheet help with winter varroa management?
Yes, in two ways. First, your pre-winter counts (ideally from August and September) tell you whether your fall treatment worked and whether the colony is going into winter below the safe threshold (around 1 to 2%). Second, a broodless winter alcohol wash in December or January confirms your fall treatment held, and tells you whether a late-winter oxalic acid treatment is warranted before spring buildup begins.
What sampling error should I worry about most when logging mite counts?
Sampling from the wrong location is the biggest error. Bees on capped brood frames carry far more mites than foragers or bees on honey frames. Always shake your sample from a frame with visible capped brood. Also watch for inconsistent sample size. Use 200 bees sometimes and 300 other times without recording which, and your percentage calculations are wrong half the time and your trend data is unreliable.
How do I use my spreadsheet trend data to decide when to treat?
Look at your last three counts for each hive. If mite percentages are rising steadily, extrapolate. If counts climb 0.6 percentage points every three weeks and you're at 2.4% now, you'll cross 3% before your next planned check. Treat on the trajectory rather than the current number. A flat trend below 2% in early summer is a very different situation from a rising trend at 1.8% in August.
Sources
- Honey Bee Health Coalition, Varroa Management Guide: Action threshold of 3% (3 mites per 100 bees) during brood season; 2% heading into winter; alcohol wash recommended over sugar roll; sticky boards not reliable for treatment decisions; monthly monitoring and post-treatment monitoring recommended; sugar roll undercounts mites by roughly 40% vs. alcohol wash
- University of Minnesota Extension, Varroa Mite Management: 2% late-season threshold and recommendation to treat before winter bee production; regional varroa management guidance
- Penn State Extension, Oxalic Acid for Varroa Control: Oxalic acid most effective in broodless conditions; efficacy of 90%+ reduction in mite loads when applied correctly in broodless colonies
- EPA, Apivar (Amitraz) Label and Registration: Apivar strip treatment period is 6-8 weeks; effective in presence of brood; expected mite load reduction to under 1% with correct application
- EPA, Mite-Away Quick Strips (MAQS) Label and Registration: MAQS application temperature range constraint (typically 50-85°F) required for safe and effective use; legal label is the binding reference
- Penn State Extension, Beekeeping Resources: Penn State Extension publishes beekeeping management resources and field data forms for monitoring
- USDA Agricultural Research Service, Varroa destructor Biology: Varroa mite populations can roughly double every 12-15 days under favorable brood conditions
- UC Davis Honey Bee Research Facility, Varroa Monitoring Methods: Alcohol wash using approximately 300 bees (half cup) from a brood frame is the standard field method for mite load assessment
- North Carolina State University Apiculture, Varroa Management: Consistent monitoring methods and recording of treatment dates recommended for evaluating colony health trends
- University of Georgia Cooperative Extension, Honey Bee Health: Post-treatment monitoring two to four weeks after treatment used to verify efficacy of varroa control products
Last updated 2026-07-09