How to calculate varroa mite population growth rate
TL;DR
- Varroa populations grow exponentially, not linearly.
- The core calculation uses a growth-rate formula (r = ln(N2/N1) / t) that tells you how fast mites multiply between two counts.
- A colony can go from a safe 1% infestation to a lethal 6%+ level in 6 to 8 weeks during peak brood season.
- Your r-value tells you when to treat before the damage is done.
Why does varroa population math matter so much?
Varroa destructor doesn't grow in a straight line. It grows exponentially, which means a colony that looks fine in June can be collapsing by August. Most beekeepers understand that mite counts matter. Fewer understand the rate at which those counts change, and the rate is what kills colonies.
The Honey Bee Health Coalition's Varroa management guide puts it plainly: mite populations can double in a matter of weeks when brood is abundant and no treatment is applied [1]. A beekeeper who checks in April, sees 1%, and figures they have all summer isn't wrong about the number. They're wrong about what that number will become.
Mite population growth rate gives you a timeline. It turns a snapshot (the count you took today) into a forecast (when will this colony be in trouble). That's the difference between reacting to a dead-out and staying ahead of the mites.
What is the basic formula for calculating varroa growth rate?
The standard way to express population growth in biology is the intrinsic rate of increase, written as r. For varroa in a real hive, you calculate it like this:
r = ln(N2 / N1) / t
Where:
- N1 is your mite count (as a percentage or raw number) at time 1
- N2 is your mite count at time 2
- t is the time elapsed between the two counts, in weeks or days (pick one unit and stick with it)
- ln is the natural logarithm
Say you did an alcohol wash in week 1 and got 1.5%, then repeated it four weeks later and got 3.0%. The calculation runs:
r = ln(3.0 / 1.5) / 4 = ln(2) / 4 = 0.693 / 4 = 0.173 per week
That number, 0.173 per week, is your growth rate. On its own it isn't intuitive. It gets useful when you convert it to doubling time.
Doubling time = ln(2) / r = 0.693 / 0.173 = 4.0 weeks
So mites in that colony are doubling every four weeks. Start at 1.5%, go 12 weeks without treating, and you're looking at roughly 12% infestation. That's a dead colony [2].
What do real varroa growth rates look like in practice?
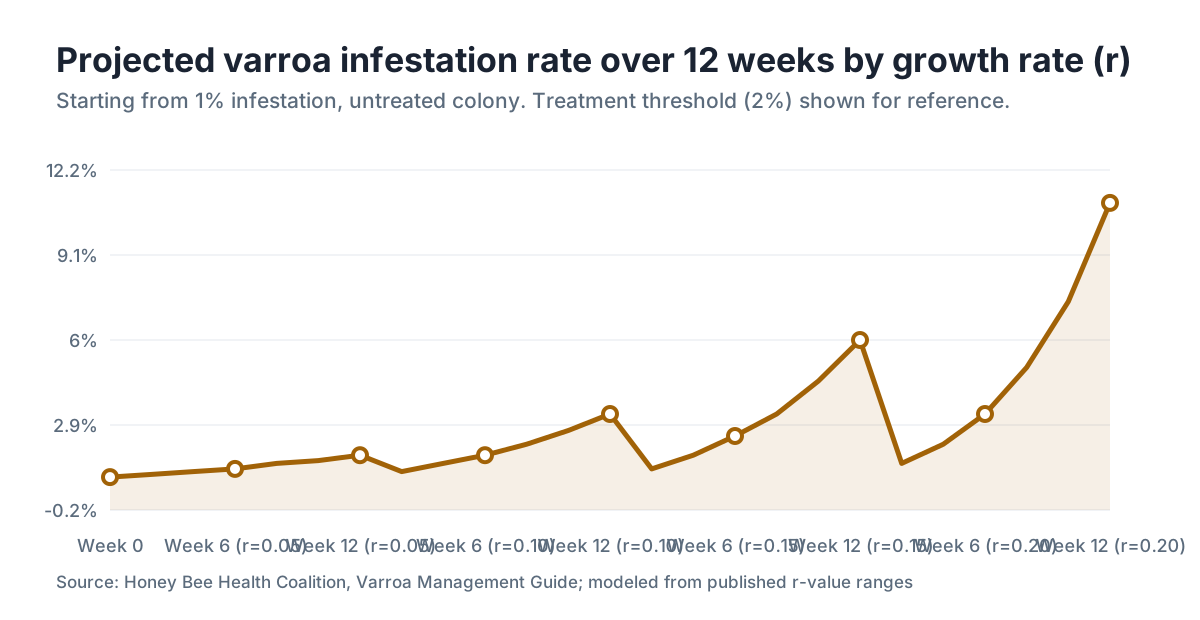
Published research gives us solid reference points. A 2016 study by Calis, Boot, and colleagues measured varroa population dynamics in untreated colonies and found the mite population can increase by a factor of 8 to 12 over a single brood season in temperate climates [3]. That translates to a weekly r somewhere between 0.10 and 0.20 under normal summer brood conditions.
The table below shows what different r-values mean for doubling time and the time it takes to climb from a 1% infestation to a 3% threshold:
| Growth rate (r, per week) | Doubling time | Weeks from 1% to 3% |
|---|---|---|
| 0.05 (slow, winter or low brood) | ~14 weeks | ~22 weeks |
| 0.10 (moderate spring) | ~7 weeks | ~11 weeks |
| 0.15 (active summer) | ~4.6 weeks | ~7.3 weeks |
| 0.20 (peak season, high mite pressure) | ~3.5 weeks | ~5.5 weeks |
| 0.25 (high brood, mite-susceptible bees) | ~2.8 weeks | ~4.4 weeks |
These ranges match what extension apiarists report [4]. During a honey flow with heavy brood, assume you're in the 0.15 to 0.20 range unless your bees show strong hygienic or mite-biting behavior.
One caveat. These rates assume no treatment and no natural mite mortality beyond the baseline. Some mites do fail to reproduce, so a little natural mortality happens. But at r values above 0.10, reproduction outpaces it easily. Don't count on it to save you [1].
How do varroa mites actually reproduce, and why does that drive exponential growth?
Varroa reproduce only inside capped brood cells, and each reproductive cycle produces more foundresses than it started with. That compounding is why growth is exponential. A foundress mite slips into a cell just before capping, lays eggs on the developing larva, and her daughters mate inside the sealed cell with her sons. Only female offspring that mate before the adult bee emerges survive as breeders [5].
Here's the engine. One foundress mite typically produces one to two new mated females per worker brood cycle under ideal conditions. Worker brood stays capped 12 days. Drone brood, capped roughly 14 to 15 days, is even more attractive to mites and buys them extra reproductive time per generation.
The variable that swings r hardest is the brood-to-adult ratio. When brood is abundant (spring and summer buildup), mites have more reproduction sites, so r climbs. When brood shrinks or disappears (late fall, winter, or after a brood break), r drops sharply, sometimes going negative as phoretic mites age and die without reproducing. That's why a broodless-period treatment can hit near-100% mite kill, while the same oxalic acid application during peak brood barely dents the capped population [6].
This is also why colonies headed for collapse look fine to a beekeeper who only watches adult bee numbers. By the time the adult population visibly crashes, the damage has been building inside capped cells for weeks.
What mite count thresholds should trigger treatment?
The threshold question is where the math turns into action. The most widely cited treatment thresholds in the United States come from the Honey Bee Health Coalition's guide and from state extension recommendations [1][4].
For alcohol wash or sugar roll (sample of about 300 bees from the brood nest):
- 2% or higher at any time during the active season: treat
- 1% or higher in August through September (heading into winter buildup): treat immediately
- Some programs use a 3% mid-season threshold, but extension apiarists at Penn State and NC State both recommend acting at 2% to avoid falling behind the growth curve [4]
For sticky board counts (24-hour natural mite drop):
- These are less reliable for calculating r because drop rates shift with colony size and season, but a rough rule is 50 to 100 mites per day signals a serious infestation that needs treatment. Most programs now favor alcohol wash over sticky boards for measuring actual infestation rate.
The growth rate tells you something the threshold alone can't: how much time you have. A colony at 1.8% with an r of 0.05 is a different animal from a colony at 1.8% with an r of 0.20. With two counts on record, you can tell which one you're holding.
How do you set up a monitoring schedule to track growth rate?
You need at least two data points, taken with the same method, to calculate r. Three or more points show whether the rate is accelerating or slowing, which tells you more.
A practical schedule for the active season looks like this:
Count 1: Early April (or when pollen is coming in and brood is building)
Count 2: Four to six weeks later
Count 3: Four to six weeks after that (usually late May or early June)
Count 4: Late July or early August (this is the one that catches people off guard)
Count 5: September 1 to 15 (this one decides your winter)
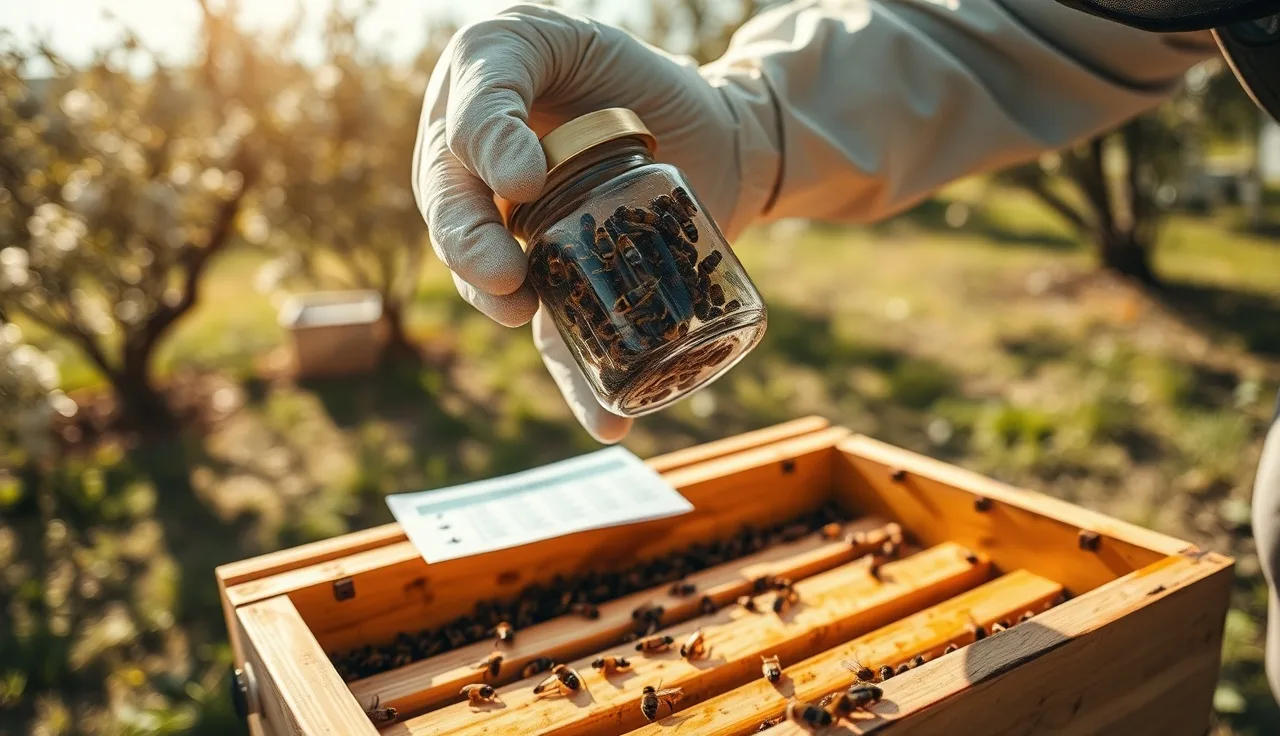
Always sample from the brood nest, not the honey supers. Use alcohol wash, not sugar roll, for better accuracy. University of Minnesota Extension recommends a minimum 300-bee sample [10]. Wash, count, and record the percentage, the date, and the colony ID.
Then do the math. r = ln(N2/N1) / t. Use weeks as your time unit and you can compare r values directly across intervals and across colonies. If your r is above 0.15 and you're still six weeks out from your planned treatment date, move that date up.
Tools like VarroaVault's free mite tracking calculator run the r calculation for you and flag colonies growing faster than a threshold you set. That removes the arithmetic barrier when you're managing more than a couple of hives.
How does brood break change the mite growth rate?
A brood break drives r to zero or below faster than anything else you can do. That's true whether the break is natural (winter) or intentional (caging the queen, pulling brood frames, or splitting the colony). With no capped brood, mites have nowhere to reproduce. Phoretic mites age and die at a slow but steady rate, and no new mites are being made [6].
Researchers in Europe and North America have documented oxalic acid vaporization during a broodless period reaching 95%+ mite mortality in a single treatment [6]. During active brood season, the same treatment kills only the 10 to 25% of mites that are phoretic (riding adult bees) at the moment you apply it. The capped mites survive, emerge, and get back to reproducing.
For the mathematically inclined: a brood break sets N2 = N1 x e^(r_phoretic x t), where r_phoretic is negative because mite mortality is happening against zero reproduction. Rough estimates put r_phoretic during broodlessness around -0.02 to -0.05 per week. Mites die off slowly on their own. Then you hit that smaller population with oxalic acid at its most exposed moment.
This is why experienced beekeepers pair a late-November or early-December oxalic acid treatment (when natural broodlessness arrives in many climates) with a summer brood break if counts are trending high [1].
Does bee genetics affect the mite growth rate formula?
Yes, and this is one of the more interesting spots where the formula meets real-world variation. The r you calculate is a property of the mite population in your specific colony, and your bees' genetics push it up or down.
Colonies with strong hygienic behavior, specifically mite-biting (also called mite chewing) or VSH (varroa-sensitive hygiene) traits, have lower realized r values because worker bees interrupt mite reproduction. VSH bees can suppress mite reproductive success by 50 to 90% compared to standard stock, according to USDA Agricultural Research Service data [7]. That drops straight into your r.
In practice, if you're running standard Italian or Carniolan stock with no selection for mite resistance, assume r trends toward the high end of the 0.10 to 0.20 range through summer. If you're running locally selected VSH or mite-biting stock, your r might stay below 0.10 even at peak brood. The only way to know is to calculate it from your own hive records.
This is also why blanket treatment schedules (treat every August 15, no matter the count) are a rough guess at best. The same colony in two different years, or two colonies in one apiary, can carry very different r values and very different risk timelines.
What are the most common mistakes beekeepers make when calculating mite growth rate?
The biggest mistake is comparing counts taken with different methods. An alcohol wash and a sticky board count are not interchangeable numbers. If your first count came off a sticky board and your second came from an alcohol wash, your calculated r is garbage. Pick one method and use it every time.
The second common error is sampling at the wrong place in the hive. Mite loads run highest in the brood nest. Pull your alcohol wash sample from bees near the top of the hive or the entrance (foragers or house bees far from brood) and you'll undercount. Shake bees from a brood-nest frame straight into your jar.
A subtler mistake is using raw mite counts instead of percentages. If your colony grew from 10,000 bees to 40,000 between counts, a raw mite tally that holds steady actually means a fourfold drop in infestation rate. Always convert to percentage: (mites counted / bees in sample) x 100 [1].
And many beekeepers space their counts too far apart. At r = 0.20, a colony crosses 2% in about five weeks starting from 1%. Count every eight to ten weeks and you'll stay behind, every time. Four to six week intervals during the active season give you enough resolution to actually use the growth rate.
How do you use the growth rate to decide which treatment to use?
Once you know r, two numbers steer you: your current infestation percentage and how fast it's changing. Together they decide more than whether to treat. They decide which treatment fits.
For a colony at 1.5% with a low r (say 0.05 to 0.08), you've got several weeks of buffer. A slower treatment works fine: oxalic acid vaporization over a 3-week repeated schedule, or formic acid (Formic Pro) on the longer single-strip protocol. These are gentler and have shorter re-entry restrictions.
For a colony at 1.5% but a high r (0.18 to 0.25), the math says you're at 3%+ within three to four weeks. That calls for something faster. Amitraz (Apivar) starts pulling mite loads down quickly and gives roughly 8 weeks of residual protection [8]. Amitraz is EPA-registered for varroa control and carries specific label requirements you have to follow, including temperature ranges and honey super removal [8].
For a colony already at 3% or above, treatment is urgent no matter what r says. At that level, colony symptoms (deformed wing virus, crawlers, spotty brood) may already be showing. Fast action beats picking the most elegant option.
A solid reference for treatment options, efficacy data, and label summaries is the Honey Bee Health Coalition's Varroa management guide and extension resources at land-grant universities [1][4].
Managing more than a few hives, the colony-by-colony math gets tedious fast. VarroaVault's free protocol tools log counts and auto-flag colonies by r-value quartile, so you know which hives to hit first when time or product runs short.
How does varroa growth rate change through the seasons?
The r value shifts through the year. It tracks brood availability almost directly, lagging a week or two, because reproductive success depends on when mites enter cells more than when you happen to count them.
Here's the typical arc in a temperate climate (USDA hardiness zones 5 to 7):
January to February: r near zero or slightly negative. Little or no brood, surviving mites phoretic and aging.
March to April: r starts climbing as the queen ramps up laying. Expect r in the 0.05 to 0.10 range.
May to June: r accelerates into 0.10 to 0.20 as the colony hits peak brood area. This is the danger window most beekeepers underestimate, because the hives look healthy and packed.
July to August: r may peak and then level off as the colony shifts toward raising winter bees. Absolute mite pressure is at its highest, and those fall bees are being reared on potentially heavily parasitized larvae.
September to October: brood area contracts, r falls. But the damage to winter bees from August and September mite reproduction is already done.
November to December: r approaches zero again. Natural broodlessness in most temperate climates.
UC Davis entomologists and the Honey Bee Health Coalition both point to the August-September window as the one that decides winter survival [1][9]. A count and growth-rate calculation in late July or early August is arguably the most important one you'll run all year.
Can you calculate varroa growth rate without a calculator?
Yes, with a simple approximation. If you'd rather skip natural logarithms, borrow the rule of 70 from finance as a close-enough estimate:
Doubling time (in weeks) = 70 / (percent growth per week)
First estimate your percent growth per week. If mites went from 1% to 2% in five weeks, that's roughly a 14% compound weekly rate. The ln-based math gives a cleaner answer, but for a field decision the approximation gets you there.
Even simpler heuristic: if your mite percentage doubled in six weeks or less, you're in trouble. Treat now, whether or not the absolute number has crossed 2%.
For the real ln calculation, any smartphone calculator app has a natural log function (usually labeled 'ln'). Type ln(N2/N1), divide by the number of weeks, and you've got r. Forty-five seconds with your data in hand.
Keeping records in a spreadsheet? A formula like =LN(B2/B1)/(C2-C1) does it automatically once you've set up columns for date and infestation percentage. The arithmetic was never the obstacle. The habit of counting on schedule is.
Frequently asked questions
What is a dangerous varroa mite growth rate?
An r value above 0.15 per week means your mite population doubles roughly every 4.5 weeks. That's fast enough to push a colony from a safe 1% infestation to a lethal 6%+ level in about eight to nine weeks. During peak summer brood, rates of 0.18 to 0.22 are common in untreated colonies with standard (non-VSH) genetics. Treat before you cross 2% rather than waiting to see how fast the numbers climb.
How often should I count mites to track the growth rate?
Every four to six weeks during the active season. That interval gives you enough time for a meaningful change while still leaving room to intervene before the population crosses treatment thresholds. In late July and August, tighten to every three to four weeks. In winter, once at the start of the season and once before spring buildup is plenty. Two counts minimum are needed to calculate any growth rate.
Is alcohol wash or sticky board better for calculating varroa growth rate?
Alcohol wash, by a wide margin. Sticky board counts get pushed around by colony size, weather, and natural mite behavior in ways that make them unreliable as a percentage estimate. Alcohol wash gives you a direct infestation rate (mites per 100 bees) that plugs straight into the growth-rate formula. Penn State Extension and the Honey Bee Health Coalition both recommend alcohol wash as the gold standard for monitoring [1][4].
Can varroa mite growth rate go negative?
Yes. A negative r means the mite population is shrinking. This happens naturally during a broodless period (winter or an intentional brood break), when phoretic mites die without a chance to reproduce. It also happens after a successful treatment. A negative r after treatment confirms the intervention worked. If r stays positive after treatment, you may have resistant mites or reinfestation from nearby colonies.
Does a higher mite count always mean a faster growth rate?
No, and this is one of the most common misconceptions. A high count today tells you where you are. The growth rate tells you how you got there and where you're going. A colony at 3% with a low and falling r (treated three weeks ago) is a completely different situation from a colony at 3% with a high and rising r. You need at least two data points taken the same way to know which one you have.
How does drone brood affect varroa population growth rate?
Drone brood has a longer capping period (roughly 14 to 15 days vs. 12 for workers), giving varroa more time to complete reproductive cycles. Mites preferentially infest drone cells at rates roughly eight to ten times higher than worker cells, according to research cited by USDA ARS [7]. Colonies with heavy drone production can carry higher effective r values than colonies with the same phoretic mite load but less drone brood.
What is the formula for varroa mite doubling time?
Doubling time = ln(2) / r, where ln(2) = 0.693 and r is your calculated growth rate per week. If r = 0.15, doubling time is 0.693 / 0.15 = 4.6 weeks. You need at least two mite counts taken with the same method to calculate r first. Once you have doubling time, project how many weeks until you hit a treatment threshold by multiplying doubling time by however many doublings it takes to get there.
Does robbing or drift affect my varroa growth rate calculation?
Yes. Robbing events and drift from high-mite colonies can cause sudden jumps in your count that look like a very high r but are actually a one-time infestation event rather than local reproduction. If your count spikes sharply and you know there was a nearby honey flow collapse or robbing event, treat the high count as real (because it is) but don't read the r value as a prediction of future reproduction in isolation.
How does varroa growth rate differ between Italian, Carniolan, and VSH bees?
VSH (varroa-sensitive hygiene) and mite-biting stocks have significantly lower realized r values because worker bees interrupt mite reproduction inside cells. USDA ARS data show VSH bees can suppress mite reproductive success by 50 to 90% [7]. In practice, a standard Italian colony might run r = 0.18 in mid-summer while a VSH colony in the same apiary sits at r = 0.06. Both still need monitoring, but their treatment urgency timelines differ a lot.
What mite infestation level is fatal to a colony?
There's no single number, because colony size and timing both matter. Most extension sources and the Honey Bee Health Coalition treat 6% infestation as critically high at any time of year, and 3% as the urgent treatment threshold in late summer when winter bees are being raised [1]. A colony going into winter at even 3% has very poor survival odds, because mites damage the hypopharyngeal glands of the long-lived winter bees the colony depends on.
Can I use a mite wash count from one hive to estimate another hive's growth rate?
No. Mite populations vary a lot from colony to colony in the same apiary, even hives a few feet apart, thanks to differences in genetics, brood patterns, and local drift and robbing. The Honey Bee Health Coalition recommends monitoring every colony individually rather than spot-sampling a subset [1]. Using one hive's r to estimate another's gives you unreliable risk assessments.
How do I know if my varroa treatment actually worked, using growth rate math?
Count mites before treatment, then again three to four weeks after treatment ends. Calculate r for the post-treatment interval. If r is negative or near zero, the treatment worked. If r is still positive and above 0.10, something went wrong: the treatment was applied incorrectly, temperatures fell outside the label range, you have resistant mites, or the colony is being reinfested from nearby untreated hives. Investigate before assuming the treatment failed on its own.
Is there software or a tool to calculate varroa mite growth rate automatically?
Several exist. VarroaVault offers free mite tracking tools that calculate r automatically from logged counts and flag colonies over a growth threshold. The Honey Bee Health Coalition's guide includes manual worksheets. Any spreadsheet with an LN function works fine. The tool matters less than the habit of entering counts after every monitoring event. Paper records that never get analyzed are no better than no records.
Sources
- Honey Bee Health Coalition, Varroa Management Guide (latest edition): Varroa mite populations can double in a matter of weeks during peak brood season in untreated colonies; the Coalition recommends treatment at 2% infestation during the active season and 1% in late summer.
- Penn State Extension, Bee Lab: Colonies with mite infestation rates above 6% face severe brood damage and colony collapse; the 2-3% range is the practical treatment trigger for most beekeepers.
- Journal of Apicultural Research, Calis et al., population dynamics of Varroa destructor: Varroa mite populations can increase by a factor of 8 to 12 over a single brood season in untreated temperate-climate colonies.
- Penn State Extension and NC State Extension, varroa treatment thresholds: Extension apiarists recommend treating at 2% infestation during the active season to avoid falling behind the mite growth curve.
- USDA Agricultural Research Service, Varroa destructor biology overview: Varroa mites reproduce only inside capped brood cells; a foundress typically produces one to two viable mated female offspring per worker brood cycle under ideal conditions.
- EPA, Oxalic Acid Product Registrations for Varroa Control: Oxalic acid treatments applied during a broodless period achieve 95%+ mite mortality; efficacy is substantially lower when capped brood is present.
- USDA ARS, Honey Bee Breeding, Genetics, and Physiology Lab, Baton Rouge: VSH bees suppress varroa mite reproductive success by 50 to 90% compared to standard stock; drone brood is infested at rates 8 to 10 times higher than worker brood.
- EPA, Apivar (amitraz) product label and registration: Amitraz (Apivar) is EPA-registered for varroa control with an 8-week application period; honey supers must be removed during treatment.
- UC Davis Department of Entomology, Honey Bee Research Facility: The August-September monitoring window is the most consequential for colony winter survival because mites parasitizing winter bees during this period impair their longevity and immune function.
- University of Minnesota Extension, Bee Lab, Varroa mite monitoring methods: A minimum 300-bee alcohol wash sample from the brood nest is recommended for reliable infestation percentage estimates.
Last updated 2026-07-10